Keystone XL, Pipeline Safety, and the Reality of Oil Dominance
“Like any industry, many of the energy industries come with risks. But it does not stop our need for energy to fuel our economy and secure America. And the track record has been pretty good,” Chris John, president of the Louisiana Mid-Continent Oil and Gas Association, 20101
The BP Deepwater Horizon spill, pipeline leaks, population growth, urbanization, increasing demand, and opposition to the siting of new pipelines have combined to focus greater attention on pipeline safety. In North America, TransCanada’s proposed US$ 13 billion Keystone XL pipeline system, which could ship 700,000 bpd of heavier crude oil from Alberta, Canada to US Gulf Coast refineries, has been at the top of the headlines. Although the process of getting oil – the world’s most important energy source – from the ground into our vehicles and airplanes is far more challenging than is generally understood, spill statistics verify the tremendous strides that continue to be made. Unfortunately, the anti-fossil fuel crowd has morphed recent accidents into an all-out assault on the oil industry’s established safety record:
- “This spill [Deepwater Horizon] reveals a serious lack of safety surrounding the oil industry,” Amy Klobuchar, US Senator, D-Minnesota.2
- “It [Deepwater Horizon] kind of confirms our worst fears that we’ve had about the oil industry all along – that they cut corners where they can,” Athan Manuel, Director, Lands Protection Program, Sierra Club.3
- “These disasters [pipeline leaks] make it clear that the BP disaster isn’t a rare accident. These are daily occurrences. These are daily incidents of not paying attention,” Tim Warman, Director, Global Warming Solutions Program, National Wildlife Foundation.4
Nevertheless, oil’s leading role in the US energy economy is virtually guaranteed to continue. Under the International Energy Agency’s latest 450 Scenario, which optimistically assumes that 'collective policy action is taken to limit the long-term concentration of greenhouse gases [GHGs] in the atmosphere to 450 parts per million of CO2-equivalent,' oil still constitutes 30% of domestic energy demand in 2030.5 Thus, considering that a single cartel, OPEC, controls 80% of proven global reserves, and the growth of China and India affirms that competition for liquid fuels will be increasingly fierce, the need to produce and transport as much oil as possible within North American borders is a non-negotiable pillar of US energy security. Policy will need to focus on enhancing, not impeding, the regional suppliers and transporters of this irreplaceable liquid fuel. Pipeline connections with Canada are especially crucial because Alberta holds 180 billion barrels of free market oil, and 75% of the US crude supply, and 60% of refined products, is moved by pipeline.6
Safety History and Incentives
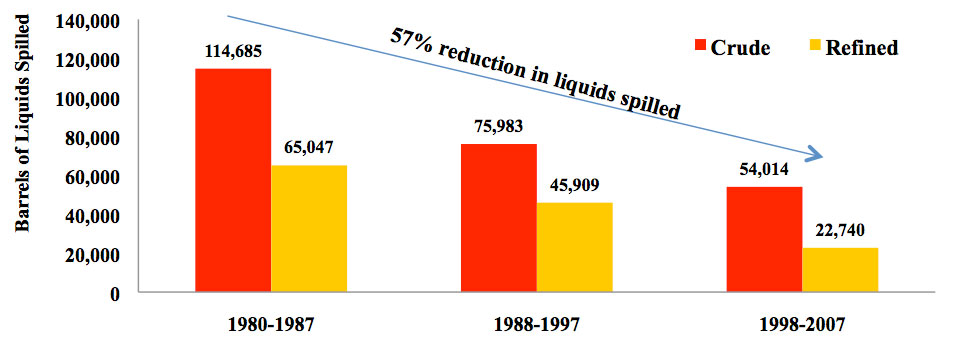
Oil pipeline operators invest millions of dollars every year to maintain their pipelines and comply with federal pipeline safety laws and regulations. Companies are always looking to reduce risks by taking measures to minimize the probability and severity of accidents. These precautions include: proper pipeline route selection, design, construction, operation, and maintenance, as well as comprehensive public awareness and excavation damage prevention programs. Despite the inherent complexities, the US oil industry keeps a detailed focus, and the frequency of releases from pipelines has been steadily declining (see Figure 1). According to the Association of Oil Pipe Lines and the American Petroleum Institute, from 2006-2008, there were 0.44 incidents per 1000 km of pipeline, compared to 1.24 incidents per 1,000 km from 1999-2001 – a drop of 65%.7 Similarly, the number of barrels released per 1000 km decreased from 391 in 1999 - 2001 to 205 in 2006 - 2008; a decline of 48%. These reductions have been occurring in the face of higher demand, and from 2001 to 2009, the US oil pipeline system was extended by 9%, from 254,680 km to 276,890 km.8
Although widespread use and non-stop movement make spills inevitable, the oil industry continues to strive for zero releases, zero injuries, zero fatalities, and no operational interruptions. And we can expect more vigilance in the years ahead because they recognize that aging infrastructure will see higher throughput and transport. As reasoned by Lee Hunt, President of the International Association of Drilling Contractors, oil companies have a “vested interest in being as safe as possible.”9 In addition to lost expensive product, the US Environmental Protection Agency estimates that it costs about $220 to clean up a single gallon of oil.10 The Deepwater Horizon spill in April 2010 caused a major shakeup at BP, and by June, the company’s market capitalisation had been sliced in half by $95 billion.11
Figure 1. Average annual liquids spillage from coastal and inland US pipelines, 1980-2007
|
Note: The United States uses 100,000 barrels of liquids every seven minutes |
The Importance of Canada
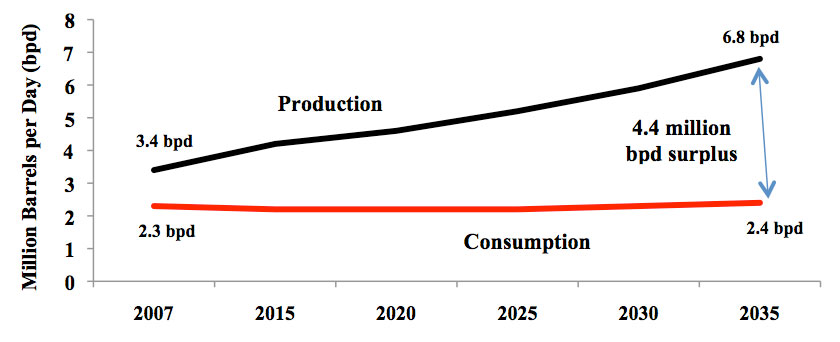
High depletion rates are placing relentless pressure upon the need to not only meet incremental global demand but to also replace declining reservoirs. The world confronts the problem of ongoing depletion in many of its major fields, most notably the supergiant Cantarell in Mexico, a top-three US supplier. The US faces the prospect of extended supply shortages, rising prices, worsening trade deficits, and ongoing national security vulnerabilities. Canada, meanwhile, is a dependable supplier and longtime ally. In 2010, total liquid fuel supplies from Canada (2.5 million bpd) were higher than those of second place Mexico and third place Saudi Arabia combined. Canada’s massive oil sands resource, which yields about 1.5 million bpd a year, accounts for 45% of the country’s total production. Some forecasts project that Canada’s oil sands output could double by 2017 and reach 5 million bpd by 2030. A low population growth rate will keep organic demand around 2.3 million bpd, so much of the surplus oil is expected to be headed south to the US, where production has steadily declined since peaking in 1970. Canada’s export capacity is projected to quadruple from 2007 to 2035 (see Figure 2). Indeed, Chinese investment in the Alberta oil sands has topped $13 billion in the past two years alone.12
Figure 2: Canada’s Expanding Export Capacity, 2007 - 2035
|
Source: US Energy Information Administration, International Energy Outlook 2011 (PP. 150 and 249) |
The Inaccuracies of the National Resources Defense Council (NRDC) Study
A main point of contention has been the perceived new risks to pipeline integrity of transporting the heavier tar sands oil that dominate in Alberta. The February 2011 report by the NRDC, Tar Sands Pipelines Safety Risks, claimed that these pipelines are more likely to fail and cause environment damage than other crude pipelines because the bitumen mixtures they would carry are “significantly more corrosive to pipeline systems than conventional crude,” among other reasons.13 The NRDC has called for a moratorium on approving new pipelines from oil sands regions and a review of existing pipeline permits until the safety concerns involved are studied further. Canada’s Energy Resources Conservation Board (ERCB), however, strongly objects to the NRDC’s claims. More specifically, the ERCB reports that the NRDC analysis used factual inaccuracies and a flawed methodology in a misleading comparison of pipeline failures between the US and Alberta:14
- NRDC Myth: “…..Alberta’s hazardous liquid system…..had over four times as many reportable incidents per mile as the older US System between 1990 and 2005.”
- ERCB Fact: “…..the NRDC did not recognize that the ERCB requires all incidents to be reported, regardless of whether or not any product is spilled, and also regardless of spill volume…..in the US only spills of five barrels of liquids or more are required to be reported.”
- NRDC Myth: “…..there are many indications that DilBit [diluted bitumen] is significantly more corrosive to pipeline systems than conventional crude.”
- ERCB Fact: “Analysis of pipeline failure statistics in Alberta has not identified any significant differences in failure frequency between pipelines handling conventional crude versus pipelines carrying crude bitumen…..Once mixed with diluent, DilBit should behave in much the same manner as other crude oils of similar characteristics.”
In fact, from 1990 to 2005, the ERCB has found only three spills that resulted from internal corrosion in pipelines shipping bitumen and blends of bitumen, and just eight spills were found from 1975 to 2010. According to the ERCB, the resulting average failure frequency for this grouping of crude oil pipelines from 1990 to 2005 is therefore 0.03 per 1000 km per year. This is significantly lower than the U.S. rate quoted in the NRDC study of 0.08 per 1000 km per year. In 2009, Alberta posted a record-low pipeline failure rate of 1.7 pipeline failures per 1000 km of pipeline (considering all substances), “bettering the previous record-low of 2.1 set in both 2008 and 2007.”
Conclusion
Importantly, the goal to incorporate more wind and solar power will not reduce our fundamental need for more oil because oil constitutes just 2% of US electricity supply. The US Energy Information Administration projects that domestic liquid fuel consumption will expand by 10% over the next 25 years.15 As exploration and production moves toward new frontier regions, and harder to reach resources become more integral, the need to construct the transportation infrastructure required to get that oil to market will remain absolute. Looking forward, an unbiased review of the oil industry’s safety record yields just one conclusion: there is no reason to suspect that companies will not be up for the challenge.
To that end, the constant advance of technology means that we will be able produce, transport, and use oil differently tomorrow than we do today. For Alberta’s oil sands, new technologies slashed GHG emissions per barrel of production by 39% between 1990 and 2008.16 IHS CERA finds that oil sands products imported to the US now result in life-cycle GHG emissions that are, on average, just 6% higher than the average crude consumed in the country.17 Pipelines are cheaper and help lower emissions. A modest-sized pipeline transporting 150,000 bpd, for instance, moves a volume equivalent to 750 tanker truckloads per day, or a daily train of 75 rail tank cars.18 Moreover, whether new US-Canada pipelines are built or not, Alberta’s oil will find a ready market. Thus, anti-oil sands policies put the US at serious risk of letting North America’s greatest oil security blanket slip away to its growing list of competitors for no real reason.
Author: Jude Clemente, JTC Energy Research Associates.
References
[1] Bruce Alpert, April 26, 2010, “Oil rig explosion used by opponents of Obama plan to expand offshore drilling,” The Times-Picayune, available at: http://www.nola.com/politics/index.ssf/2010/04/oil_rig_explosion_used_by_oppo.html.
[2] Amy Klobuchar, May 18, 2010, “Klobuchar Presses Administration Officials, Oil Executives to Swiftly Resolve the Gulf Oil Disaster and Implement Safeguards to Prevent Future Oil Spills,” Press Release, available at: http://klobuchar.senate.gov/newsreleases_detail.cfm?id=325099&.
[3] CNN, January 7, 2011, “Environmental groups expect only small changes in oil drilling rules,” available at: http://edition.cnn.com/2011/US/01/06/gulf.spill.reax/index.html.
[4] Suzanne Goldenberg, July 29, 2010, “Oil industry safety record blown open,” Guardian UK, available at: http://www.guardian.co.uk/environment/2010/jul/29/america-bp-oil-industry-safety-record.
[5] International Energy Agency, 2010, World Energy Outlook 2010, Paris, France, pp. 630-31.
[6] Paul Parfomak, July 11, 2011, Keeping America’s Pipelines Safe and Secure: Key Issues for Congress, Congressional Research Service, available at: http://www.fas.org/sgp/crs/homesec/R41536.pdf.
[7] Timothy Felt, June 24, 2010, “Testimony of Timothy C. Felt of Colonial Pipeline Company on Behalf of the Association of Oil Pipe Lines (AOPL) and the American Petroleum Institute (API),” available at: http://www.aopl.org/pdf/Final_AOPL-API_Testimony_6_24_10_-_Final.pdf.
[8] Research and Innovative Technology Administration, 2011, “System Mileage Within the United States,” US Department of Transportation, available at: http://www.bts.gov/publications/national_transportation_statistics/html/table_01_01.html.
[9] Russell Gold and Stephen Power, May 7, 2010, “Oil Regulator Ceded Oversight to Drillers,” The Wall Street Journal, available at: http://online.wsj.com/article/SB10001424052748704370704575228512237747070.html.
[10] US Environmental Protection Agency, April 29, 2009, “Measuring Benefits of Oil Spill Prevention: Methods and Approaches,” available at: http://www.epa.gov/oem/docs/oil/fss/fss09/denning.pdf.
[11] Vince Veneziani, June 9, 2010, “BP Just Got Hammered – Stock Down 11%,” Business Insider, available at: http://www.businessinsider.com/bps-stock-just-got-blown-out-currently-down-11-2010-6.
[12] Robert Sullivan, May 31, 2011, “China’s next energy frontier: The Alberta oil sands,” Asian Correspondent, available at: http://asiancorrespondent.com/56271/china%E2%80%99s-next-energy-frontier-the-alberta-oil-sands/.
[13] Anthony Swift, Susan Casey-Lefkowitz, Elizabeth Shope, February 2011, Tar Sands Pipelines Safety Risks, National Resources Defense Council, available at: http://www.nrdc.org/energy/files/tarsandssafetyrisks.pdf.
[14] Energy Resources Conservation Board, February 16, 2011, “ERCB Addresses Statements in Natural Resources Defense Council Pipeline Safety Report,” Press Release, available at: http://www.ercb.ca/portal/server.pt/gateway/PTARGS_0_0_303_0_0_43/http%3B/ercbContent/publishedcontent/publish/ercb_home/news/news_releases/2011/nr2011_04.aspx.
[15] US Energy Information Administration, 2010, International Energy Outlook 2010, US Department of Energy, available at: http://www.eia.gov/oiaf/ieo/ieorefcase.html.
[16] Gary Mar, February 10, 2011, “Canadian Oil Sands and US Energy Supply,” Written Statement, Hearing on the Effects of Middle East Events on US Energy Markets, available at: http://republicans.energycommerce.house.gov/Media/file/Hearings/Energy/021011_Middle_East/Mar.pdf.
[17] IHS CERA, 2011, The Role of the Canadian Oil Sands in the US Market, available at: http://a1024.g.akamai.net/f/1024/13859/1d/ihsgroup.download.akamai.com/13859/ihs/cera/The-Role-of-the-Canadian-Oils-Sands-in-the-US-Market.pdf.
[18] National Academy of Sciences, 2004, Transmission Pipelines and Land Use: A Risk-Informed Approach, http://www.crss.ucsb.edu/courses/ChE124%202011/R4%20NAS%20Pipeline%20Risks.pdf.
Read the article online at: https://www.oilfieldtechnology.com/exploration/06102011/keystone_xl_pipeline_safety_and_the_reality_of_oil_dominance-/
You might also like

SPH Engineering opens applications for the first Global Drone Operations Awards
The awards are designed to recognise advanced drone operations that solve complex field challenges in industrial, scientific, and engineering environments.